How Infrastructure Monitoring and Tooling are connected with Performance Engineering


Over the last five to six years, I've had the chance to work with a few applications that are into CRM and the financial closure domains. While working as a QA Lead and Scrum Master, I was able to work as a performance tester as well. Fortunately with these applications, our customers are willing to spend some time on performance engineering and monitoring through different Application Performance Management Systems that target application performance and infrastructure monitoring. In addition to the APM systems, I was also able to setup CI environments and dashboards.
In this article, I would like to share my experience with application performance monitoring and how it is connected with Performance Engineering. First of all, I will start with the main performance approaches and talk about how we can connect tools, etc. Then what I discuss from that point on will be clearly understood.
Three Performance Engineering Approaches:
In Performance Engineering, we have 3 approaches that can be used to present the entire life cycle. These are Reactive, Proactive and Predictive.
First: Reactive Approach
When dealing with software applications, there a lot of sudden performance concerns due to various issues such as requirements not being identified properly (SLA), customer database related issues, problems in the user groups or user personas, and issues when the user load increases unexpectedly. This approach is needed, but is not encouraged as the best way of ensuring product performance. Hence, we look for a second approach.
Second: Proactive approach
In this, we are targeting a sustainable way of ensuring product performance. Nowadays, when about to start a software product implementation, we need to think about the non-functional aspects more than ever. Especially the performance engineering aspects as it will trigger issues that could lead to changing the entire application architecture at the last stages. Hence, starting the performance assessments in the early stages of the life cycle is a must. In an Agile environment, we can say it should be started from Sprint 0. Not only that, it should be carried out throughout all the sprints.
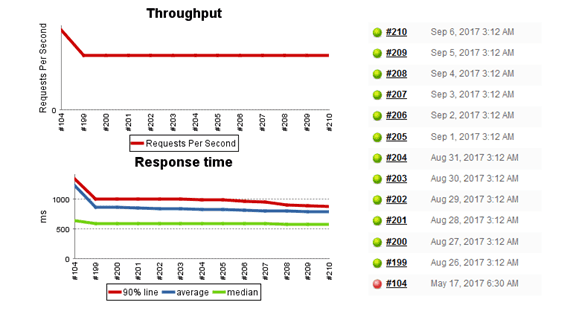
Furthermore, we need to focus more on continuous performance assessments and monitoring (unit and functional level) rather than doing manual assessments by developers or testers. By using this continuous approach, we can eliminate the cost of quality and its remedies more effectively and efficiently. By using a monitoring dashboard, we can see the release or commit-wise performance figures to detect issues ASAP. It will also increase the visibility for customers who are concerned about application performance and improvements. Say for example, if we can establish a CI environment that triggers in the nightly build, we can find the performance issues easily by spotting the trend graphs rather than waiting till hardening sprint or system tests at the end of the release. As depicted in the following images, we can display figures on the dashboard:
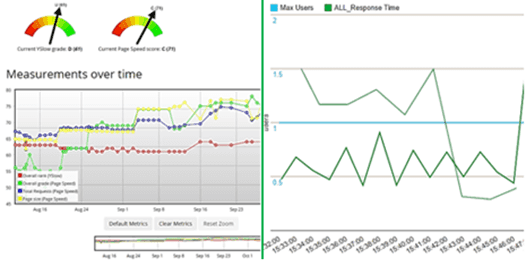
Following is the figure I took from the daily performance monitoring dashboard configured in Jenkins with the JMeter plugin. Every morning, it will be triggered and pass all the data onto the dashboard plugin:
Some of the useful links to configure the dashboard as follows:
https://www.blazemeter.com/blog/continuous-integration-101-how-run-jmeter-jenkinshttps://www.blazemeter.com/blog/how-run-taurus-jenkins-performance-plugin
Third: Predictive approach
Now I am going to talk about the approach that most project teams, customers and stakeholders neglect. However, if you noticed the topic of the third approach, it will give you the whole idea behind this. When our application is in production, it’s not enough to deal with the development and continuous CI environments. Hence, we must work on the production figures and trends to analyze current user behaviors to identify usage patterns. In other words, we should be able to predict or forecast future loads and their impact (E.g.: To identify seasons or dates such as Black Friday, etc).
As I told you in the first paragraph, there are a lot of APM (Application Performance Management) systems in the market to get this valuable data and deliver great digital customer experience. Therefore, real user relations and critical transactions can be monitored and analyzed down to code level. So we can categorize those as standalone applications and systems that come with the cloud platforms.
Following are some standalone APM systems in the market that we can use (just a few):

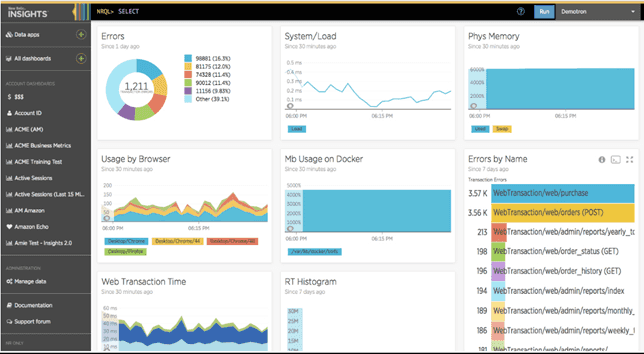
I had a chance to work with the New Relic tool and it has most of the features that should be incorporated into such applications - very good visualization and data analysis, including finding the most cumbersome SQL queries, etc. Following is a sample dashboard that used New Relic insights:
If using cloud platforms, then we can use Application Insights with Azure and CloudWatch with AWS:

Both Azure and AWS have built-in solutions for keeping data and tracking of metrics with the online alerting system. These tools are there to see the big picture of what is going on with your platform as a service environment, like standing on Mount Everest and watching everything below. If we talk about Azure application insights, we can make its own Dashboard or show the data through the PowerBI.
The first thing you see after you log in to the Azure portal is the dashboard. Here, you can bring together the charts (Server Response Time, Page View Load Time, Errors, etc) that are most important to you and to your stakeholders.
*Following are the areas of the dashboard:
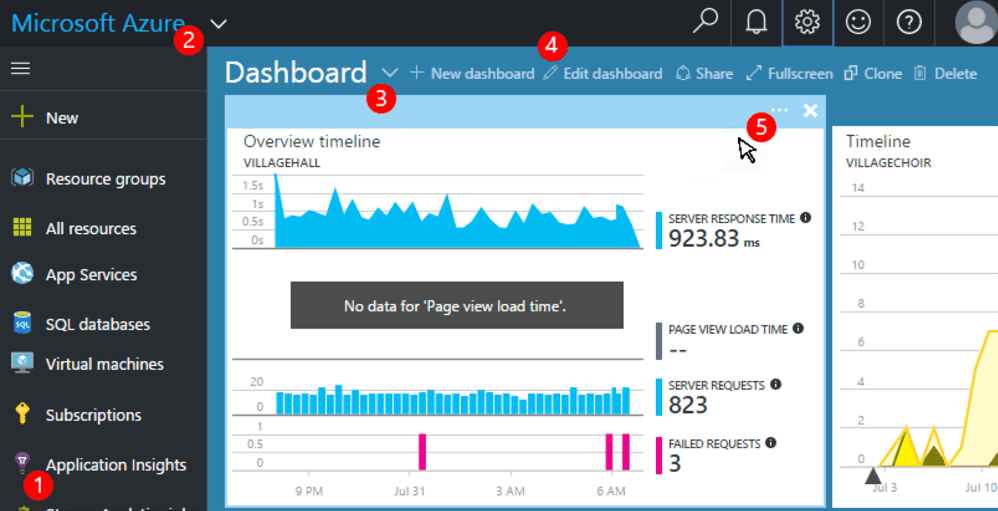
- Navigate to specific resources such as your app in Application Insights: Use the left bar.
- Return to the current dashboard, or switch to other recent views: Use the drop-down menu top left.
- Switch dashboards: Use the drop-down menu on the dashboard title
- Create, edit, and share dashboards in the dashboard toolbar.
- Edit the dashboard: Hover over a tile and then use its top bar to move, customize, or remove it.
*Taken from https://docs.microsoft.com
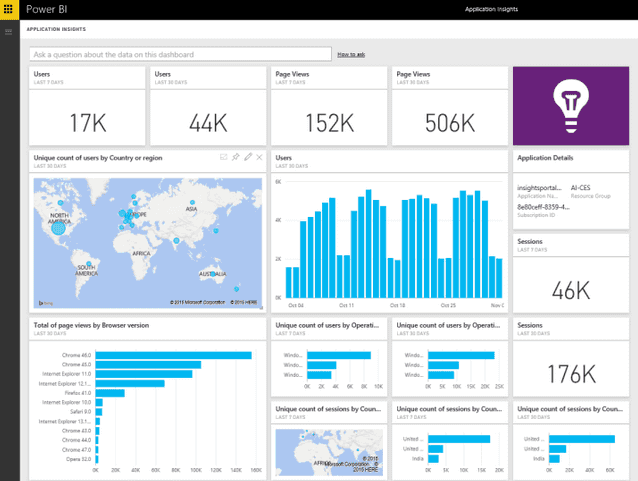
If the Azure dashboard is not good enough for you, as I told you earlier, we can use PowerBI tool easily.
PowerBI is a suite of business analytics tools to analyze and share data. Its dashboards provide a wide-angle view for business users with their most important metrics in one place.
Some of the useful links to configure PBI:
https://docs.microsoft.com/en-us/azure/application-insights/app-insights-export-power-bi
https://powerbi.microsoft.com/en-us/documentation/powerbi-content-pack-application-insights/
Not only does the PowerBI issue standard reports (adapter), but we can also get the data via Export Analytics queries and Azure Stream Analytics. In this way, you can write any query you want to use and export it to Power BI. In our current project, we are basically working with Azure Stream Analytics as it has good control of data.
https://docs.microsoft.com/en-us/azure/stream-analytics/stream-analytics-power-bi-dashboard
Hope this helped you understand the difference between these approaches and the places where we can use monitoring systems and dashboards to upgrade customer visibility, application performance and product quality.
For more from Anushka, check out his blog


