What is Postgres Query plan?


What are query plan and query planner?
When executing a query your backend will create a connection using a JDBC-like driver with the database. In Postgres, this supervisor process is called postmaster and it listens at a specified TCP/IP port for incoming connections. This postmaster maintains a one backend-process per a client process. This is called a “process per user” client/server model. So this process accepts plain text queries and passes them to the parser.
The next stage in query execution is the parser stage. In simple terms what Parser does is query syntax validation and build up the parse tree.
The third stage is referred to as the re-write system/rule system. It rewrites the parse tree generated in the second stage so that the planner/optimizer can begin working on it.
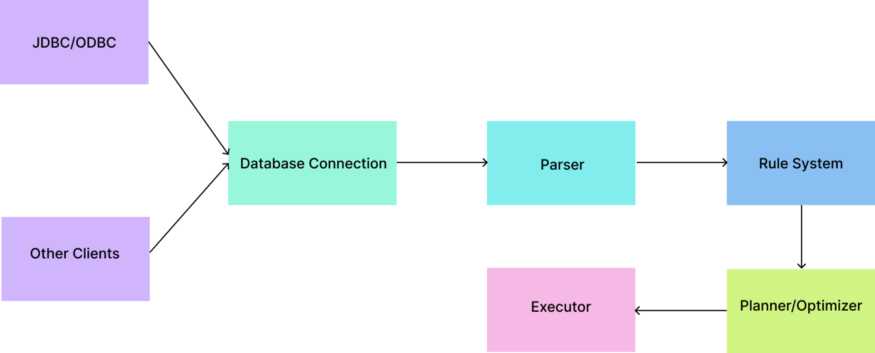
A given query tree can be executed in a variety of ways, all of which produce the same set of results. The optimizer's job is to find the cheapest path and build a full-fledgedplan tree to pass to the executor. Finally, as the name suggests, the executor does the actual execution and returns the results.
Why do we need to know the query plan? Why peek under the hood?
It's simple, As I explained earlier, the SQL query that we're trying to execute is not the one that is actually used by the executor. Sometimes the optimizer can pick slower paths, and our SQL queries can be optimized further. So in a scenario when we notice that a querying part is slow in an API, we need to analyze and find what's going on inside the Postgres engine.
Understanding a query plan
The simplest way to fetch an execution plan is to put EXPLAIN command in front of your query. The followings are some of the options accepted by EXPLAIN command.
- ANALYZE
This executes the statement and keeps a record of the actual timing and row counts. This is critical in identifying the source of incorrect cardinality estimates (row count estimates).
note — EXPLAIN ANALYSE runs the query in the database in real-time. Keep that in mind when you use this with queries like UPDATE.
- VERBOSE
The VERBOSE parameter allows you to display additional plan information.
- BUFFERS
This explains how much data had to be retrieved from the disk and how much data was retrieved from the PostgreSQL cache.
- SUMMARY & TIMING
These options are enabled by default when ANALYZE is used. SUMMARY can be used to get summarized information about the query plan (e.g., totaled timing information) and TIMING will include actual startup time and time spent in each node.
- COSTS
This option is set to true by default and does not need to be explicitly specified unless you want to set them to FALSE. This includes information on each plan node’s estimated startup and total cost, as well as the estimated number of rows and width of each row.
- FORMAT
This allows you to specify the output format of the query plan. Text (Default), JSON(Above example), XML, YAML are the options available.
Let’s analyze a simple select * query
For the demonstration, I’m going to use a sample database from postgresqltutorial.com. Find it here if you want to try it yourself. Let’s start with the most simple select-all query.
EXPLAIN (ANALYZE, VERBOSE, BUFFERS)
SELECT * FROM public.actor
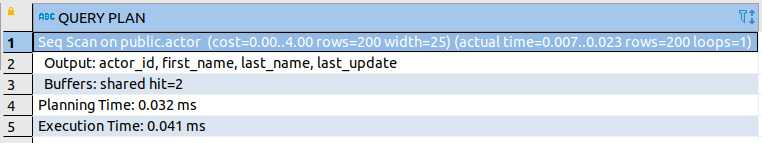
Let’s go through what you can find in this query plan.
- Seq Scan - This is the scan method that is used to fetch results.
- Cost - This is the estimated time from the query planner.
- Rows - The total number of rows returned.
- Loops - How many times this will run. In this case, it will only run once because we are fetching all data.
Let’s take a bit complex query with conditions so that we can understand the tree structure
Before executing the query, I have created an index on the payment amount.
CREATE INDEX payment_amount_idx ON public.payment (amount);
EXPLAIN (ANALYZE, VERBOSE, BUFFERS)
SELECT paym.payment_id, cust.customer_id,cust.first_name, paym.amount
from payment paym
INNER JOIN customer cust
	ON cust.customer_id = paym.customer_id
WHERE amount > 5
ORDER BY payment_id
The query plan is a tree-like structure. A block separated by a -> is called a node. These are individual execution points. The query planner starts the execution with the most inner node and then it returns the value to the outer function.
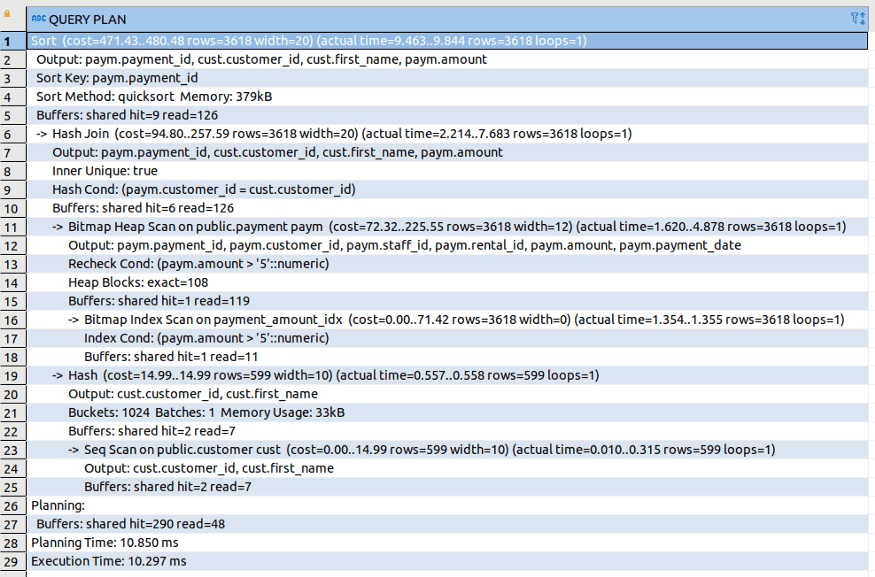
In the above execution plan, we can see there are two nodes that are having the same priority. shared hit essentially means the value has already been cached in the main memory of the computer and it was not necessary to read this from the hard disk. The shared hits of the outer node will equal to total shared hits of child nodes.
Shared-read 290 means that 290 blocks (each 8k) had to be read from the hard disk to get the full results set. If we re-run this again, the query read will be 0 and shared-hit will equal the total of previous shared reads and hits.
Operation types in Postgres
The operations in the query plan can be divided into two main categories.
- Single child operation - Sort, Aggregate
- Multi-child operation - Hash join, Parallel hash join, Merge join
In the above example, we can find some operations like sort, join and scan. So each node in the plan performs an operation and passes the results up to the next node in the plan until it reaches the root operation.
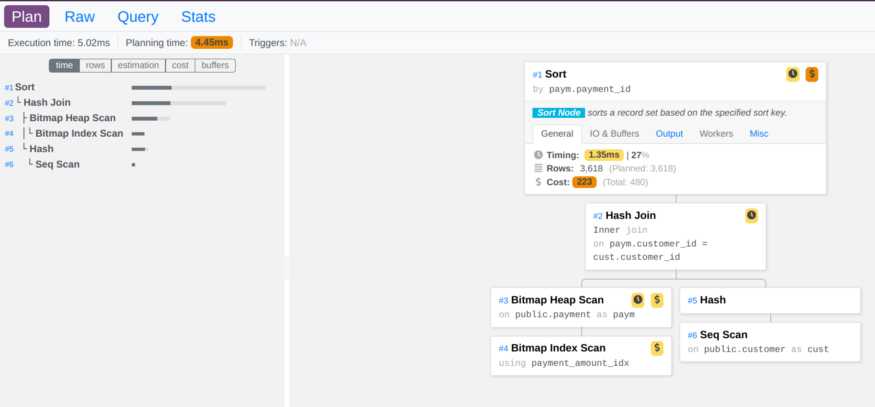
Postgres query plan visualization
There are tons of online PostgreSQL execution plan visualizers available freely available. explain.dalibo.com is the one that I use personally. All you need to do is run your query with the following options to get the query plan in JSON format. This will give you all the under-the-hood info to analyze and understand the actual behavior of your queries.
EXPLAIN (ANALYZE, COSTS, VERBOSE, BUFFERS, FORMAT JSON)
Thanks for reading. For further details, you can visit referenced sites too. Happy coding!
References
Anatomy of a PostgreSQL Query Plan —dzone.com
The Path of a Query-www.postgresql.org


